Non-Invasive Glucose Estimation from Wrist PPG
Rebuilding motion-corrupted signals with a conditional VAE before predicting blood glucose
Finger-prick tests and implanted sensors are still how most people with diabetes track their blood glucose. Both are uncomfortable and expensive, which is why estimating glucose from a smartwatch’s optical sensor is such an appealing idea. This post covers work I did at ASU’s ACME Lab, in collaboration with a wearables startup, on predicting blood glucose levels (BGL) from wrist-based photoplethysmography (PPG). The paper is still a draft, so treat the numbers below as preliminary.
Why PPG is hard
PPG measures blood-volume changes under the skin with LEDs and a photodetector. Glucose doesn’t show up in that signal directly. It nudges vascular tone and blood viscosity, which subtly change the waveform’s shape. The trouble is that plenty of other things change the waveform too: skin temperature, how tightly the band sits, blood pressure, and above all, motion. On the wrist, every gesture smears the signal.
Most prior work either uses fingertip sensors (clean signal, impractical for continuous wear) or reports wrist results without saying much about how motion artifacts were handled. Reported errors for wrist-based methods sit around 13 to 20 mg/dL MAE on small or unspecified datasets. That’s well short of clinical standards like ISO 15197.
So our focus was the preprocessing: recover as much clean signal as possible before any glucose model sees it.
The pipeline
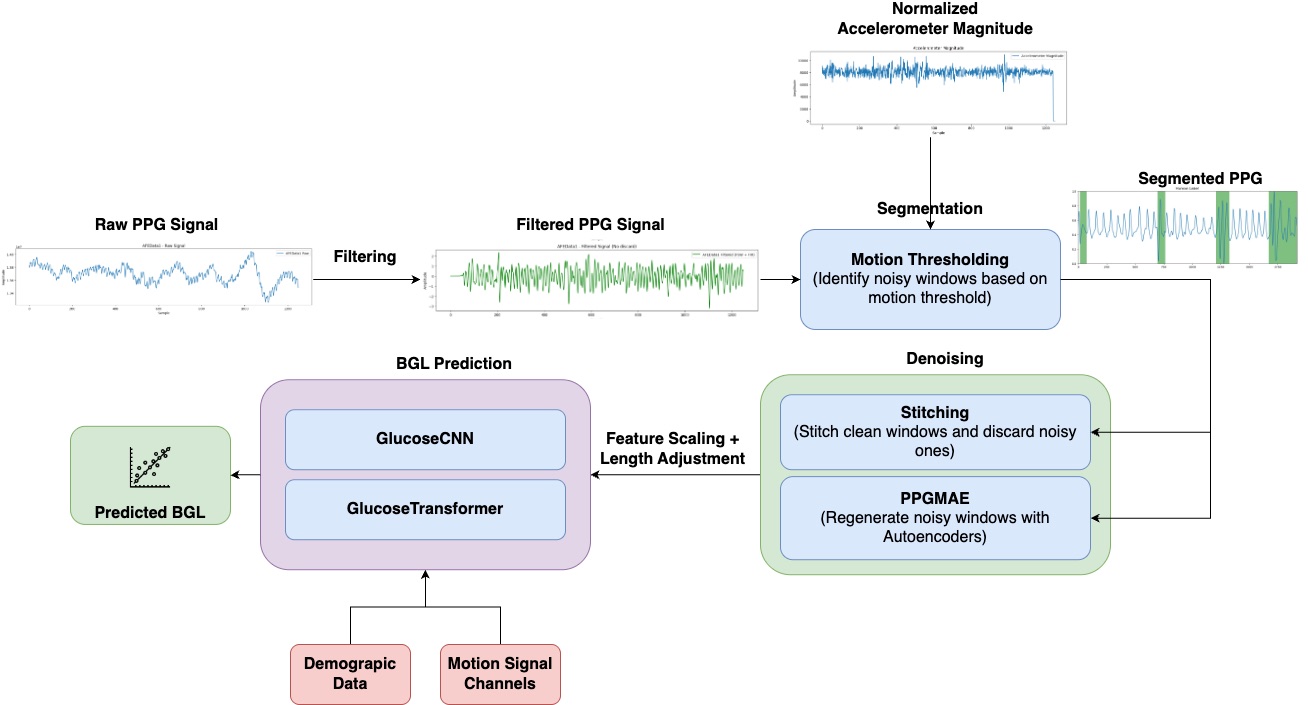
The dataset has 22 participants and about 22,000 one-minute samples. Each sample includes four PPG channels (two green LEDs, one red, one infrared, sampled at 25 Hz), a 3-axis accelerometer and gyroscope, a reference glucose reading in mg/dL, and seven demographic features (age, gender, ethnicity, skin type, height, weight, BMI).
- Filtering. Every channel is normalized, then an FIR band-pass filter removes high-frequency noise while keeping the pulse waveform intact.
- Motion thresholding. Signals are cut into 5-second windows. A window is flagged as noisy when its normalized accelerometer magnitude reaches 0.3.
- Denoising with PPGMAE. Instead of throwing noisy windows away, we regenerate them (more below).
- Cycle extraction and stitching. Clean cardiac cycles are extracted and stitched into a continuous 10-channel series (4 PPG plus 6 motion), then padded or truncated to a common length.
- Prediction. Two models take the signal tensor and the demographic vector and output a single glucose value.
PPGMAE: regenerating the noisy windows
PPGMAE is a conditional variational autoencoder. For each noisy window it sees the corrupted PPG, the clean windows immediately before and after it, the matching motion signals, and the subject’s demographics. A 1D convolutional encoder maps all of that into a 20-dimensional latent space, and the decoder reconstructs a clean window. Clean windows pass through untouched.
We chose a CVAE over a GAN because it gives uncertainty estimates and is easier to control, which matters for anything medical. PPGMAE is pretrained on the public PPG-DaLiA dataset (64 Hz PPG, with labeled noise) and then fine-tuned on our 25 Hz data.
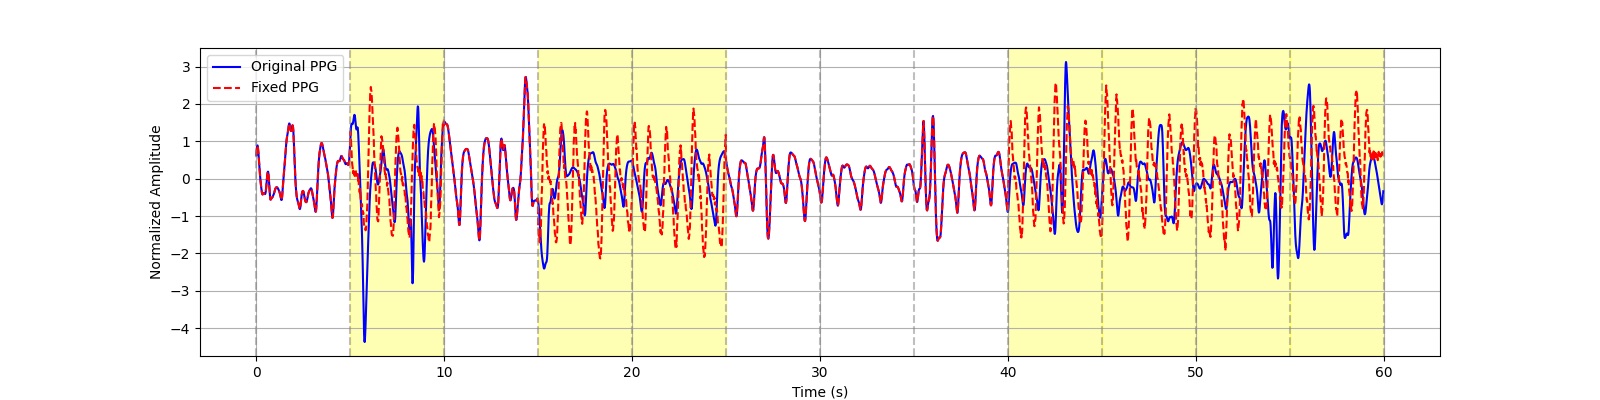
Highlighted spans are windows flagged as motion-corrupted. Blue is the original signal; red dashed is PPGMAE’s reconstruction.
Reconstruction quality improved from pretraining to fine-tuning:
| Stage | MSE | MAE | PSNR (dB) |
|---|---|---|---|
| Pretrained on PPG-DaLiA | 0.0005 | 0.015 | 33.0 |
| Fine-tuned on our data | 0.0002 | 0.010 | 37.0 |
The bigger win was data retention. Records get rejected when too few clean cardiac cycles can be extracted. The paper calls the fraction rejected this way the ILL loss. Regenerating the noisy windows brought about 2,000 records back into play:
| Preprocessing | Discarded | Retained | ILL loss |
|---|---|---|---|
| Baseline | 6,798 | 16,247 | 29.5% |
| PPGMAE (pretrained) | 5,500 | 17,545 | 23.9% |
| PPGMAE (fine-tuned) | 4,823 | 18,222 | 20.9% |
The glucose models
- GlucoseCNN is a 1D CNN that learns waveform morphology across all 10 channels, then fuses those features with the demographic vector.
- GlucoseTransformer uses self-attention to capture longer temporal patterns, with the same demographic fusion at the end.
We scored them with MAE, MARD (mean absolute relative difference), the share of predictions within ±15% of the reference, and the share of outliers off by more than 40%. We also included a ResNet34 baseline from recent TinyML work.
| Model | MAE (mg/dL) | MARD | Within ±15% | Outliers (>40%) |
|---|---|---|---|---|
| ResNet34 baseline | 31.24 | 25.38% | 38.11% | 19.44% |
| GlucoseCNN | 32.62 | 24.22% | 39.68% | 17.53% |
| GlucoseTransformer | 29.59 | 22.57% | 43.60% | 15.27% |
| GlucoseCNN + PPGMAE | 26.91 | 21.64% | 44.14% | 14.08% |
| GlucoseTransformer + PPGMAE | 24.98 | 20.13% | 46.48% | 11.66% |
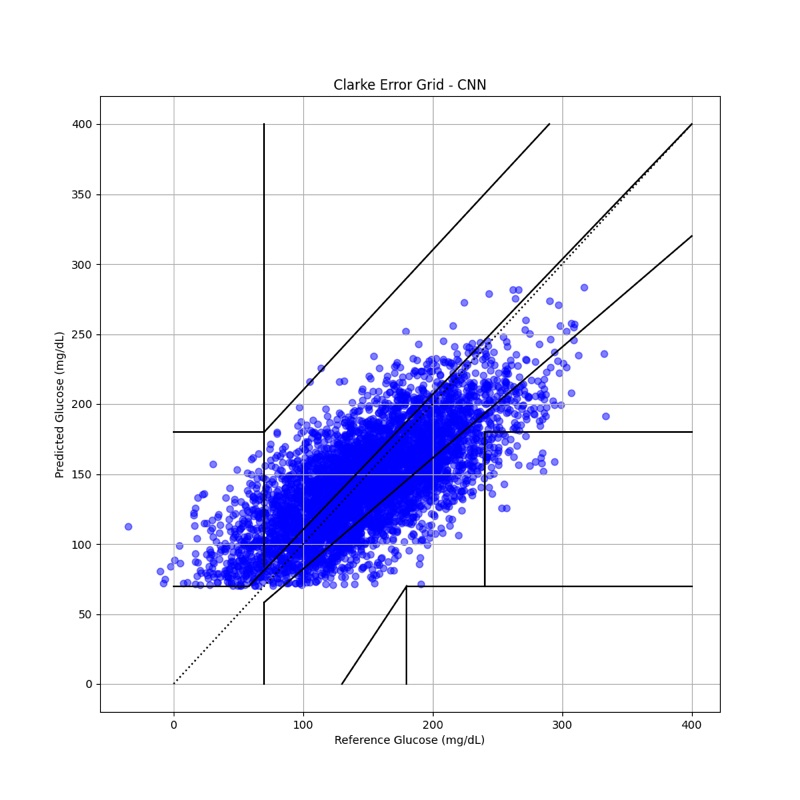
Clarke error grid for GlucoseCNN with PPGMAE reconstruction. Most predictions fall in the clinically acceptable A and B zones, but the spread is still wide.
What I took away
Denoising helped both architectures by a similar margin, which suggests the bottleneck really is input quality and not model capacity. The Transformer gained the most, cutting MAE by about 4.6 mg/dL and outliers by 3.6 points.
These numbers are still far from a clinical device. A MARD around 20% is roughly double what’s considered good for glucose monitoring, and 22 subjects is a small cohort. The direction is encouraging, though: generative reconstruction keeps data you’d otherwise discard, and it makes every downstream model better.